Mathematics Modulus Function - Basics , Graph and Transformations

Modulus Functions

Absolute value function (or modulus function)

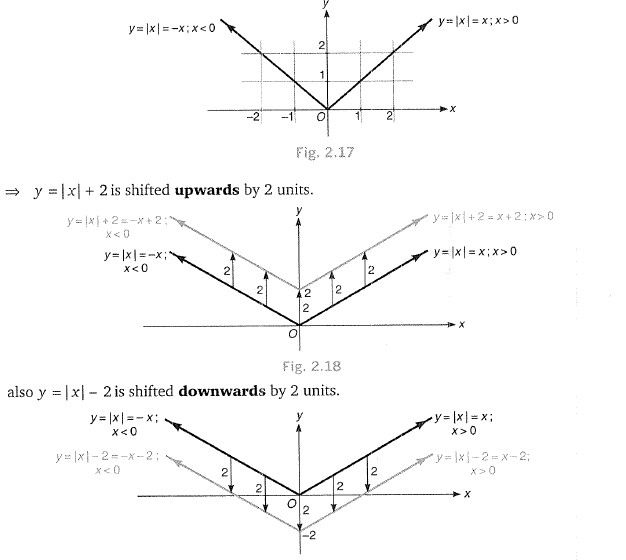
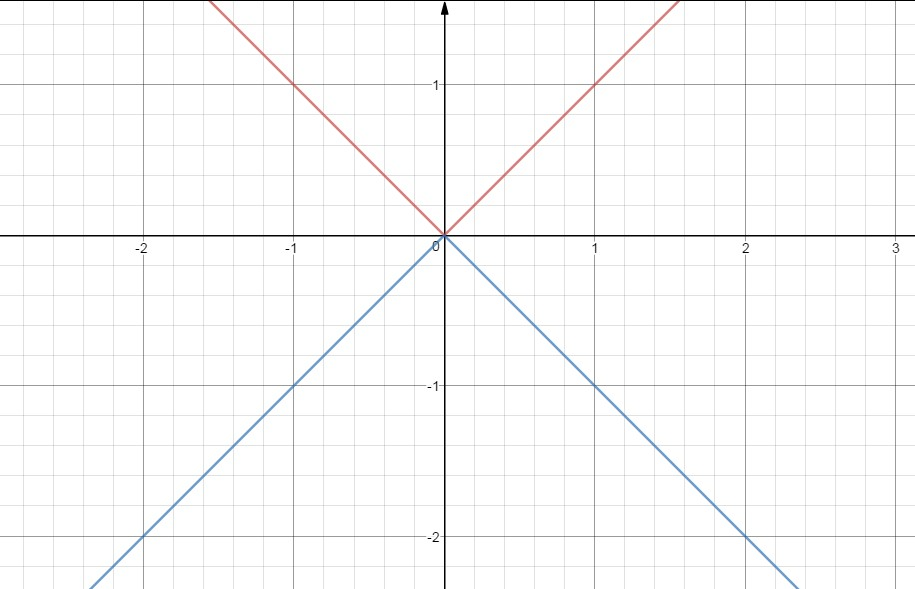
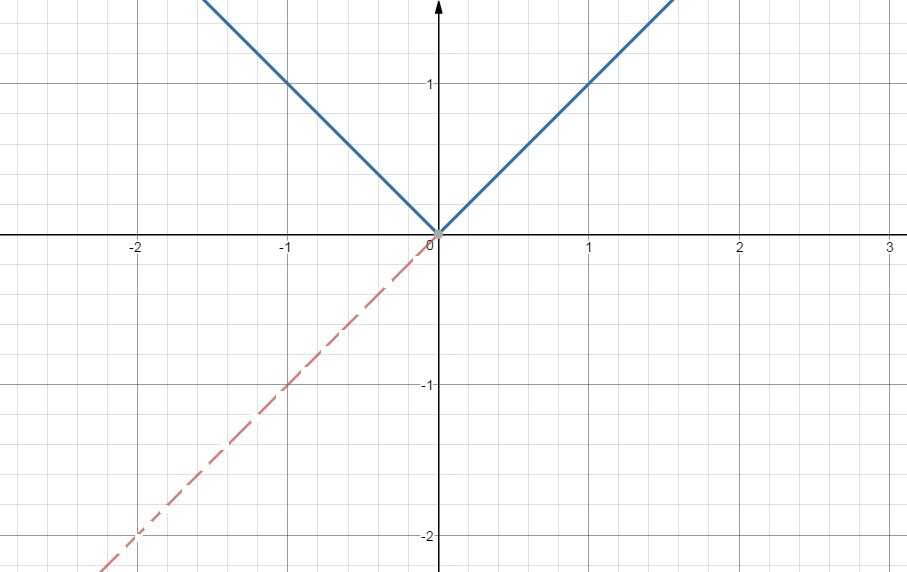
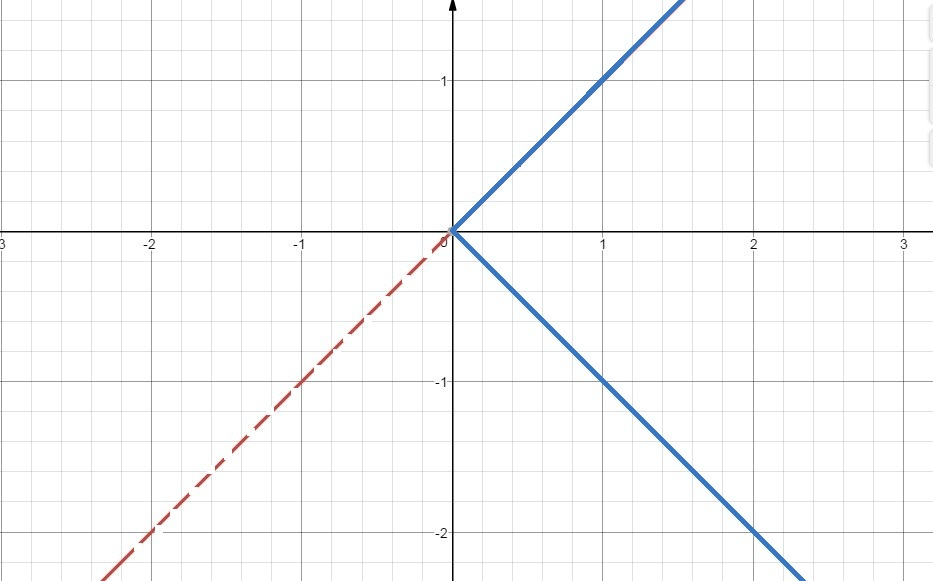
`y= |x| = { tt((x, x ge 0),(-x, x <0))`

It is the numerical value of `x`

It is symmetric about `y`-axis"

Its domain is in `R` and range `[0, oo)`.

Properties of modulus functions

(i) `| x| le a => -a le x le a ; (a ge 0)`

(ii) `|x| ge a => x le -a` or `x ge a ; (a ge 0)`

(iii) `|| x| - | y|| le |x ± y | le | x | + | y |`

Transformation of `|x|` to `|x| pm a`

Plot `y = | x| + 2` and `y = | x| - 2`, with the help of `y =| x|`·

`y =| x|` (modulus function) could be plotted as shown in Fig

`=> y =| x| + 2` is shifted upwards by `2` units as shown in Fig

also `y =| x|- 2` is shifted downwards by `2` units. as shown in Fig

Transformation of `|x|` to `|x pm a|`

Plot `y=|x|, y=|x-2|` and `y=|x+2|`

As discussed `f(x) -> f(x - a)` ; shift towards right.

`=> y=|x-2|` is shifted '2' units towards right (Fig. 3.1)

`y = | x + 2|` is shifted '2' units towards left. (Fig . 3.2)

Transformation of `|x|` to `|ax| `

Plot `y = | x|` with the help of `y =| 2x|`·

`y = |2x|` is to shrink (or contract) the graph of `y = |x|` by 2 units along x-axis

Additional Examples of Transformation of `f(x)` to `f(ax)` Ex-1

Plot `y = sin x` and `y = sin 2x`.

Here; `y =sin 2x` , is to shrink (or contract) the graph of `sin x` by '2' units along `x`-axis. Shown as in Fig. 5.

Additional Examples of Transformation of `f(x)` to `f(ax)` Ex-2

Plot `y = sin^( -1) x` and `y = sin^(-1) (2x)`.

Here; `y = sin^(- 1) (2x)` , is to shrink (or contract) the graph of `sin ^(-1 )x ` '2' times along `x`-axis.

Shown as in Fig. 6

Additional Examples of Transformation of `f(x)` to `f(ax)` Ex-3

`f(x)` transforms to `f(ax)`

i.e., `f(x) -> f(ax); a > 1`

Shrink (or contract) the graph of `f(x)` 'a' times along x-axis.

again `f(x) -> f(1/a x); a > 1`

Stretch (or expand) the graph of `f(x)` 'a' times along x-axis.

Graphically it could be stated as shown in Fig.


Additional Examples of Transformation of `f(x)` to `af(x)` Ex-1

plot `y=sinx` and `y=1/2 sin x`

As we know;

`y=1/a f(x)`

`=>` shrink the graph of `f(x)` 'a' times along `y`-axis

`:. y=1/2 sin x`

`=>` shrink the graph of `f(x)` '2' times along y-axis.

Transformation of `|x|` to `-|x|`

Additional Examples of Transformation of `f(x)` to `-f(x)`

Plot the curve `y = - e^x`

As `y = e^x` is known;

`:. y = - e^x` take image of `y = e^x` in the `x`-axis as plane mirror.

Additional Examples of Transformation of `f(x)` to `-f(x)` Ex-1

`f(x)` transforms to `-f(x)`

i.e., `f(x)-> -f(x)`

To draw `y = - f(x)` take image of `y = f=f(x)` in the `x`-axis as plane mirror.

OR

"Turn the graph of `f(x)` by `180°` about `x`-axis."

Additional Examples of Transformation of `f(x)` to `f(-x)` Ex-1

As `y = e^x` is known; then `y = e^(-x)` is the image in `y`-axis as plane mirror for `y = e^x`; shown as;

Additional Examples of Transformation of `f(x)` to `f(-x)` Ex-2

`f(x)` transforms to `f(-x)`

i.e., `f(x)-> f(-x)`

To draw `y = f(- x)`, take the image of the curve `y = f(x)` in `y`-axis as plane mirror

OR

"Turn the graph of `f(x)` by `180°` about `y`-aixis."

Graphically it is stated as;


Transformation of `y=x` to `y=|x|`

Additional Examples of Transformation of `f(x)` to `f(|x|)` Ex-1

Plot the curve `y= |x|^2 - 2|x|-3`

As we know, the curve for `y = x^ 2- 2x-3` is plotted as shown in Fig.

`:.y=f(|x|)`, i.e., `y =|x|^ 2- 2|x|- 3` is to be plotted as shown in Fig.

which shows `y =| x|^ 2- 2| x|- 3` is differentiable for all `x in R - {0}`.

Additional Examples of Transformation of `f(x)` to `|f(x)|`

`y = | f(x) |` is drawn in two steps.

(a) In the `1^(st)` step, leave the positive part of f(x), {i.e., the part of f(x) abovex-axis) as it is.

(b) In the `II^(nd)` step, take the mirror image of negative part of f(x). {i.e., the part of f(x) below x-axis} in the x-axis as plane mirror.

or

Take the mirror image (in x-axis) of the portion of the graph of `f(x)` which lies below x-·axis.

or

Turn the portion of the graph of `f(x)` lying below x-axis by 180° about x-axis.

Additional Examples of Transformation of `y = f(x)` to ` |y| = f(x)`

Clearly `|y| ge 0` => if f(x) < 0; graph of |Y| = f(x) would not exist.

if `f(x) >= 0;` | y| = f(x) would be given as y = ± f(x).

Hence, the graph of `| y | = f(x)` exists only in the regions where f(x) is non-negative and will be reflected about x-axis only when `f(x) ge 0` "Region where `f(x) < 0` is neglected".

or

(i) Remove (or neglect) the portion of the graph which lies below x-axis.
(ii) Plot the remaining portion of the graph, and also its mirror image in the x-axis.
Graphically it could be stated as shown in Fig

Transformation of `y=x` to `|y|=x`

Additional Examples of Transformation of `y=f(x)` to `|y|= f(x)`

Plot the curve `| y| = sin x`.

Here, we know the curve for `y = sin x`.

Additional Examples of Transformation of `y=f(x)` to `|y|= |f(x)|`

Plot the curve for `|y| = |e^(-x) |`·

curve for `y =e^(-x)` is shown as;

 
SiteLock