Venn Diagrams :
`\color{purple}ul(✓✓) \color{purple} " DEFINITION ALERT"`
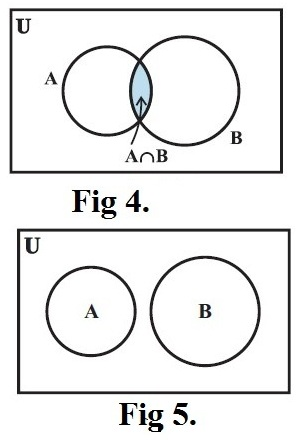
• A `\color{blue} ul(\mathtt ( \ \ VEN N \ \ Diagram))` is a diagram that uses closed curves to illustrate the relationships among sets.
• These diagrams consist of rectangles and closed curves usually circles or ellipses. The universal set is represented usually by a rectangle and its subsets by circles or ellipses.
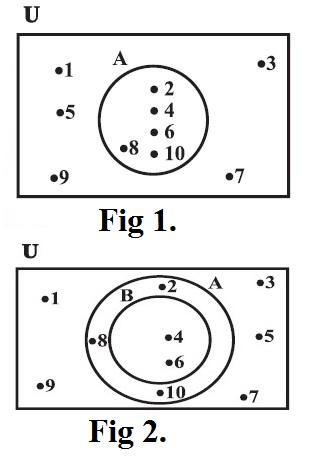
E.g. 1 : In Fiig.`1 \ \ ` `U = {1,2,3, ..., 10}` is the universal set of which `A = {2,4,6,8,10}` is a subset.
E.g. 2 In Fig ,`2\ \ ` `U = {1,2,3, ..., 10}` is the universal set of which `A = {2,4,6,8,10}` and `B = {4, 6}` are subsets, and also `B ⊂ A.`
• A `\color{blue} ul(\mathtt ( \ \ VEN N \ \ Diagram))` is a diagram that uses closed curves to illustrate the relationships among sets.
• These diagrams consist of rectangles and closed curves usually circles or ellipses. The universal set is represented usually by a rectangle and its subsets by circles or ellipses.
E.g. 1 : In Fiig.`1 \ \ ` `U = {1,2,3, ..., 10}` is the universal set of which `A = {2,4,6,8,10}` is a subset.
E.g. 2 In Fig ,`2\ \ ` `U = {1,2,3, ..., 10}` is the universal set of which `A = {2,4,6,8,10}` and `B = {4, 6}` are subsets, and also `B ⊂ A.`