`color{blue} ✍️` The resistivity of a material is found to be dependent on the temperature.
`color{blue} ✍️` Different materials do not exhibit the same dependence on temperatures. Over a limited range of temperatures, that is not too large, the resistivity of a metallic conductor is approximately given by,
`color{purple}{p_T =P_O [1+alpha(T-T_0)]}`........(3.26)
`color{blue} ✍️` where `ρ_T` is the resistivity at a temperature T and `ρ_0` is the same at a reference temperature `T_0.` `α` is called the temperature co-efficient of resistivity, and from Eq. (3.26), the dimension of `α` is `("Temperature")^(–1.)`
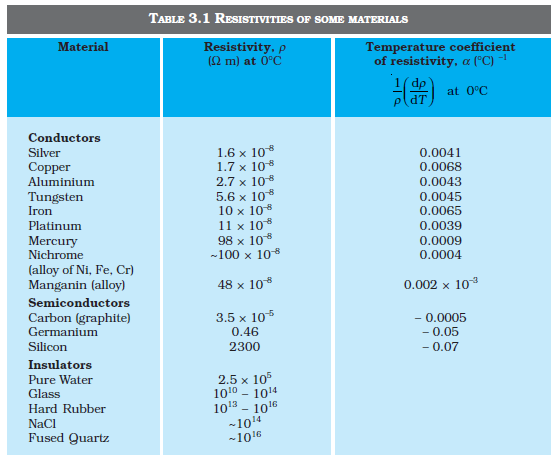
`color{blue} ✍️` For metals, `α` is positive and values of `α` for some metals at `T_0 = 0°C` are listed in Table 3.1. The relation of Eq. (3.26) implies that a graph of `ρT` plotted against `T` would be a straight line. At temperatures much lower than `0°C`, the graph,
`color{blue} ✍️` However, deviates considerably from a straight line (Fig. 3.9). Equation (3.26) thus, can be used approximately over a limited range of T around any reference temperature `T_0`, where the graph can be approximated as a straight line.

`color{blue} ✍️` Some materials like Nichrome (which is an alloy of nickel, iron and chromium) exhibit a very weak dependence of resistivity with temperature (Fig. 3.10). Manganin and constantan have similar properties. These materials are thus widely used in wire bound standard resistors since their resistance values would change very little with temperatures.
`color{blue} ✍️` Unlike metals, the resistivities of semiconductors decrease with increasing temperatures. A typical dependence is shown in Fig. 3.11.
`color{blue} ✍️` We can qualitatively understand the temperature dependence of resistivity, in the light of our derivation of Eq. (3.23). From this equation, resistivity of a material is given by
`rho = 1/sigma = m/(n e^2 tau)`........(3.27)
`color{blue} ✍️` `ρ` thus depends inversely both on the number n of free electrons per unit volume and on the average time `τ` between collisions. As we increase temperature, average speed of the electrons, which act as the carriers of current, increases resulting in more frequent collisions. The average time of collisions `τ`, thus decreases with temperature.
`color{blue} ✍️` In a metal, n is not dependent on temperature to any appreciable extent and thus the decrease in the value of `τ` with rise in temperature causes `ρ` to increase as we have observed.
`color{blue} ✍️` For insulators and semiconductors, however, n increases with temperature. This increase more than compensates any decrease in `τ` in Eq.(3.23) so that for such materials,`ρ` decreases with temperature.
`color{blue} ✍️` The resistivity of a material is found to be dependent on the temperature.
`color{blue} ✍️` Different materials do not exhibit the same dependence on temperatures. Over a limited range of temperatures, that is not too large, the resistivity of a metallic conductor is approximately given by,
`color{purple}{p_T =P_O [1+alpha(T-T_0)]}`........(3.26)
`color{blue} ✍️` where `ρ_T` is the resistivity at a temperature T and `ρ_0` is the same at a reference temperature `T_0.` `α` is called the temperature co-efficient of resistivity, and from Eq. (3.26), the dimension of `α` is `("Temperature")^(–1.)`
`color{blue} ✍️` For metals, `α` is positive and values of `α` for some metals at `T_0 = 0°C` are listed in Table 3.1. The relation of Eq. (3.26) implies that a graph of `ρT` plotted against `T` would be a straight line. At temperatures much lower than `0°C`, the graph,
`color{blue} ✍️` However, deviates considerably from a straight line (Fig. 3.9). Equation (3.26) thus, can be used approximately over a limited range of T around any reference temperature `T_0`, where the graph can be approximated as a straight line.
`color{blue} ✍️` Some materials like Nichrome (which is an alloy of nickel, iron and chromium) exhibit a very weak dependence of resistivity with temperature (Fig. 3.10). Manganin and constantan have similar properties. These materials are thus widely used in wire bound standard resistors since their resistance values would change very little with temperatures.
`color{blue} ✍️` Unlike metals, the resistivities of semiconductors decrease with increasing temperatures. A typical dependence is shown in Fig. 3.11.
`color{blue} ✍️` We can qualitatively understand the temperature dependence of resistivity, in the light of our derivation of Eq. (3.23). From this equation, resistivity of a material is given by
`rho = 1/sigma = m/(n e^2 tau)`........(3.27)
`color{blue} ✍️` `ρ` thus depends inversely both on the number n of free electrons per unit volume and on the average time `τ` between collisions. As we increase temperature, average speed of the electrons, which act as the carriers of current, increases resulting in more frequent collisions. The average time of collisions `τ`, thus decreases with temperature.
`color{blue} ✍️` In a metal, n is not dependent on temperature to any appreciable extent and thus the decrease in the value of `τ` with rise in temperature causes `ρ` to increase as we have observed.
`color{blue} ✍️` For insulators and semiconductors, however, n increases with temperature. This increase more than compensates any decrease in `τ` in Eq.(3.23) so that for such materials,`ρ` decreases with temperature.