To know more on how you can access our exclusive content, please contact us at 9899962288 for further details.
- 1 month : Rs. 300
- 3 months : Rs. 499
- 6 months : Rs. 799
- 9 months : Rs. 999
- 1 year : Rs. 1499
- 2 years : Rs. 2499
Refer a friend!
If your friend buys the course then you will get cash back offer on the following basis:
- 1 Month : Rs. 50 Cash Back
- 3 Months : Rs. 100 Cash Back
- 6 Months : Rs. 150 Cash Back
- 9 Months : Rs. 200 Cash Back
- 1 Year : Rs. 250 Cash Back
- 2 Years : Rs. 400 Cash Back
For more details on Refer system, call us on 9899962288
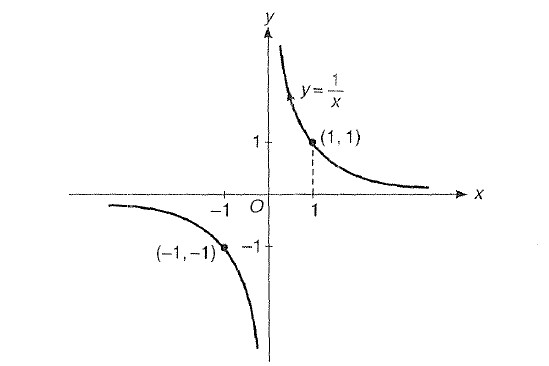
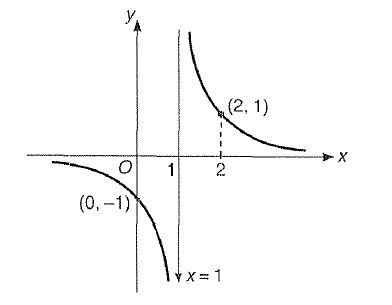
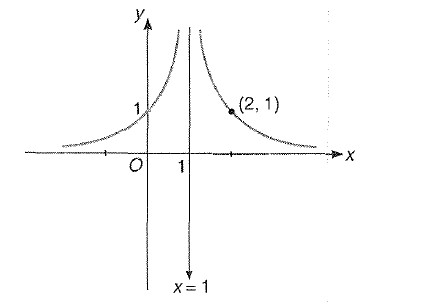
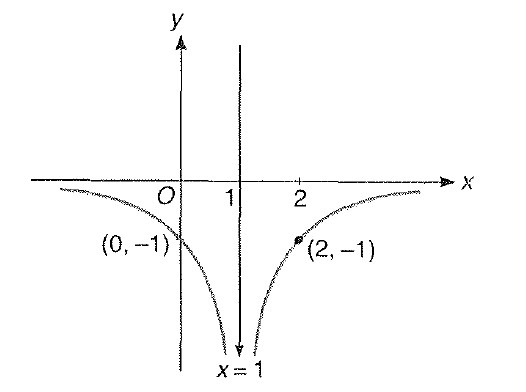
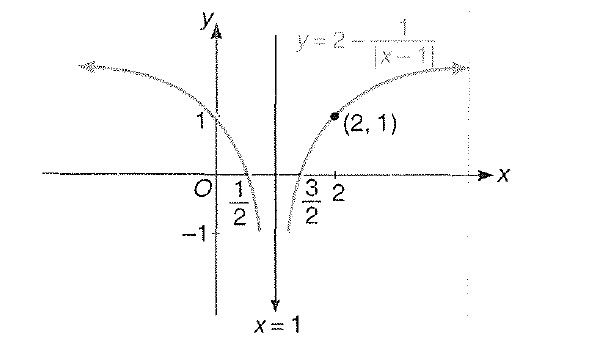
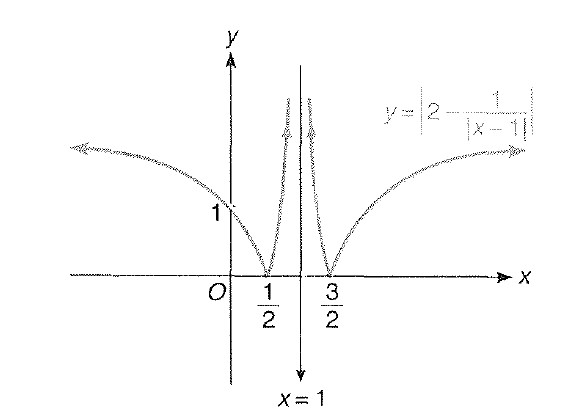
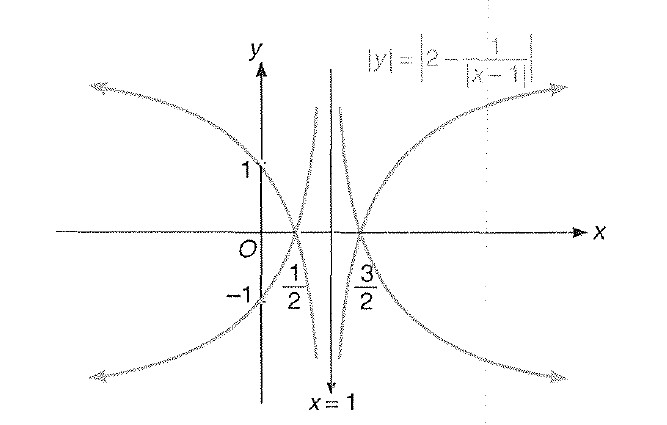
Miscellaneous Example : 1 Draw the graph of ` |y|= |2-1/(|x-1|)|`
Step 1 : We know the graph for `y =1/x` is shown as
Step 1 : We know the graph for `y =1/x` is shown as
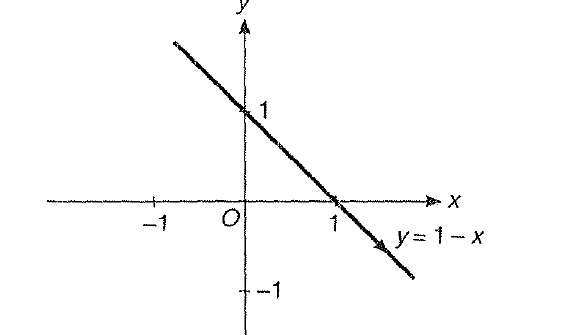
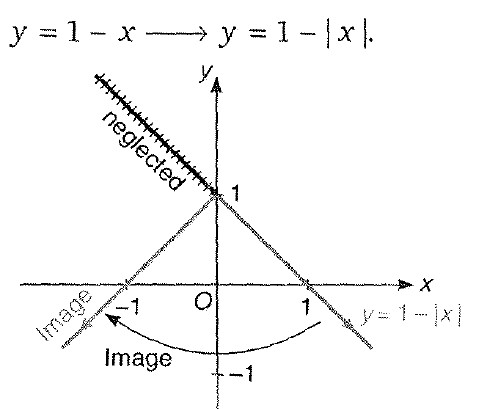
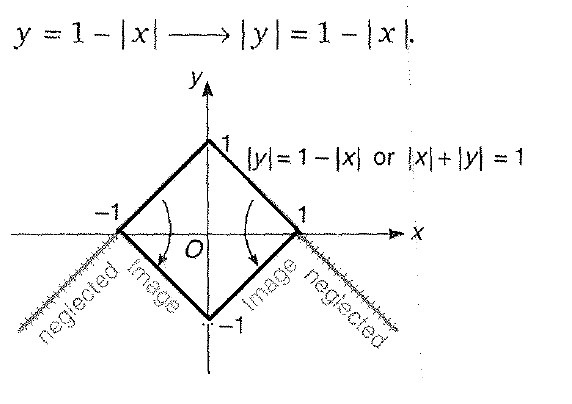
Miscellaneous Example -2 : Draw the graph of ` |x|+|y|= 1`
Step 1 : We know the graph for `y =1-x` is shown as
Step 1 : We know the graph for `y =1-x` is shown as
Step 3 : `y = 1-|x| -> 1- |x|`.
Clearly above figure represents a square.
Clearly above figure represents a square.
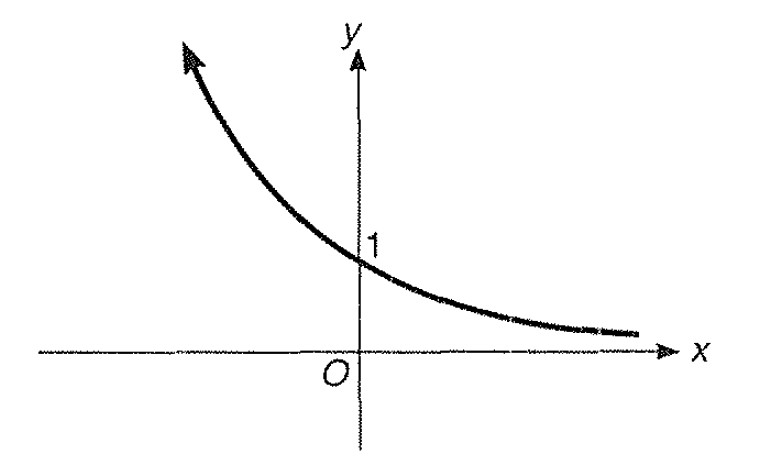
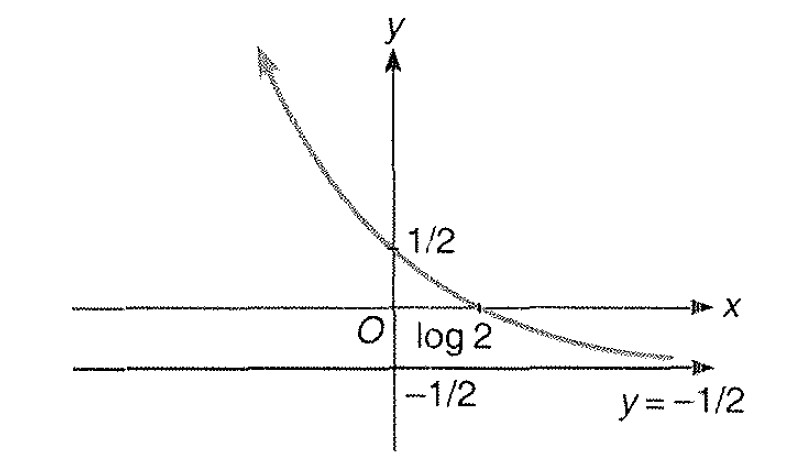
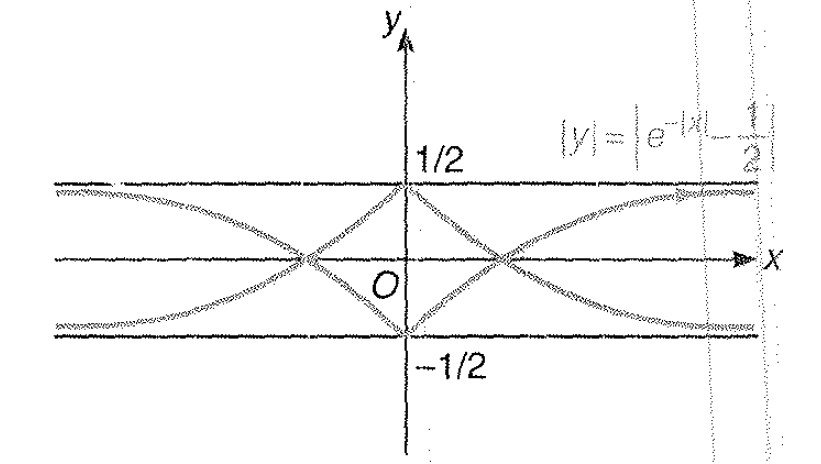
Miscellaneous Example -3 : Draw the graph of `|y|= |e^(-|x|)-1/2|`
Step: 1 we know the graph for `y =e^(-x)`.
Step: 1 we know the graph for `y =e^(-x)`.
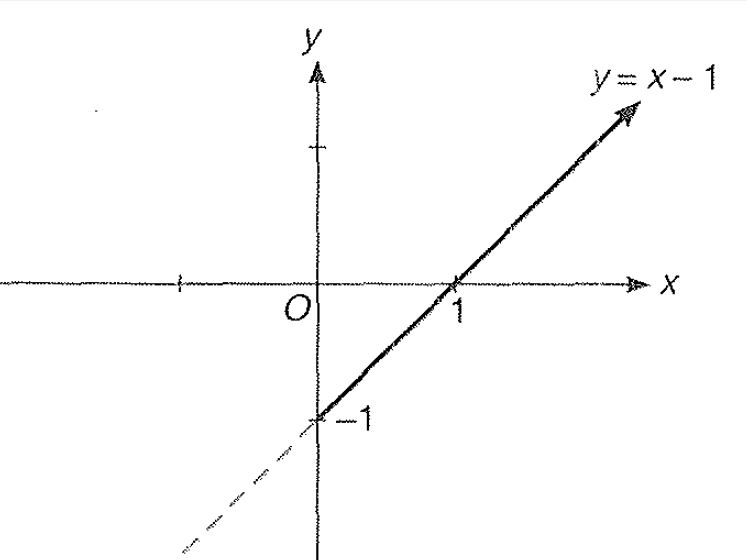
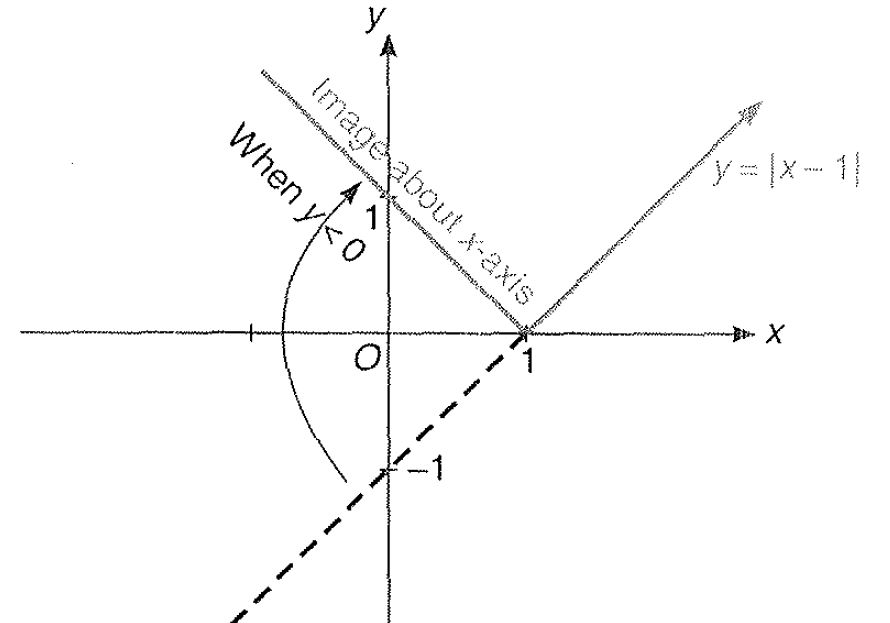
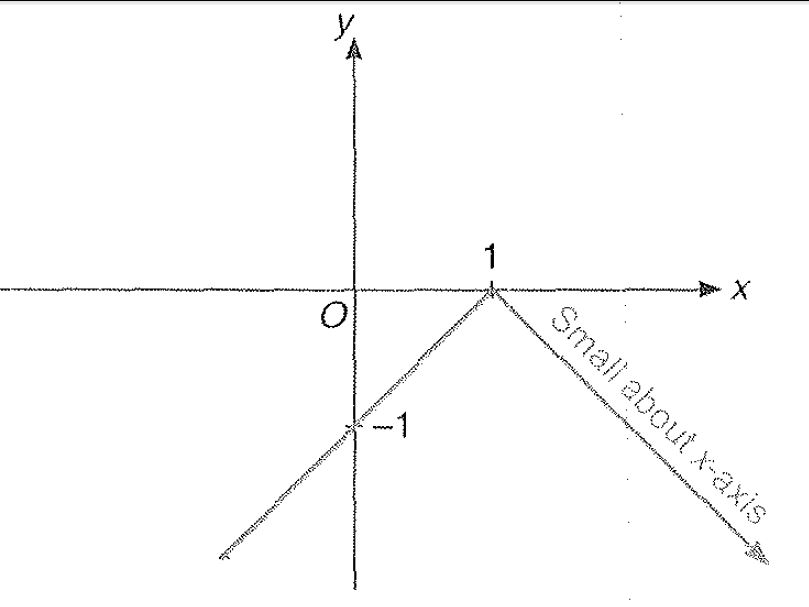
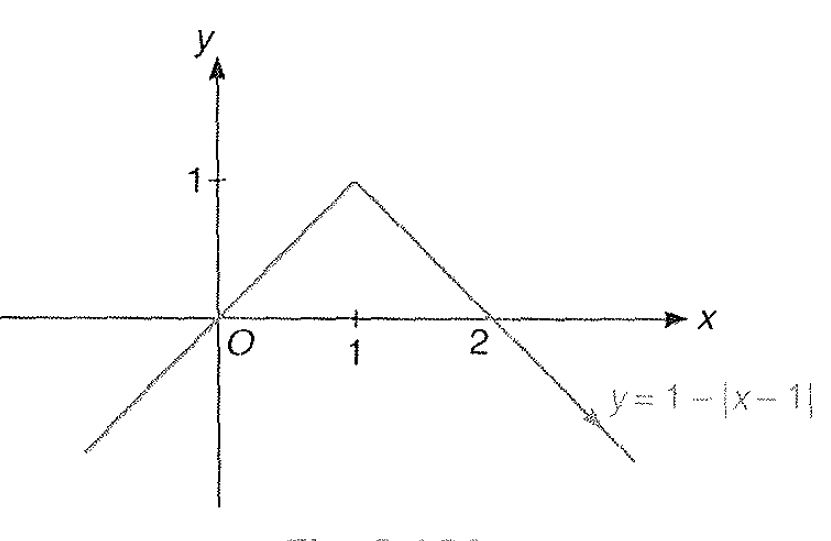
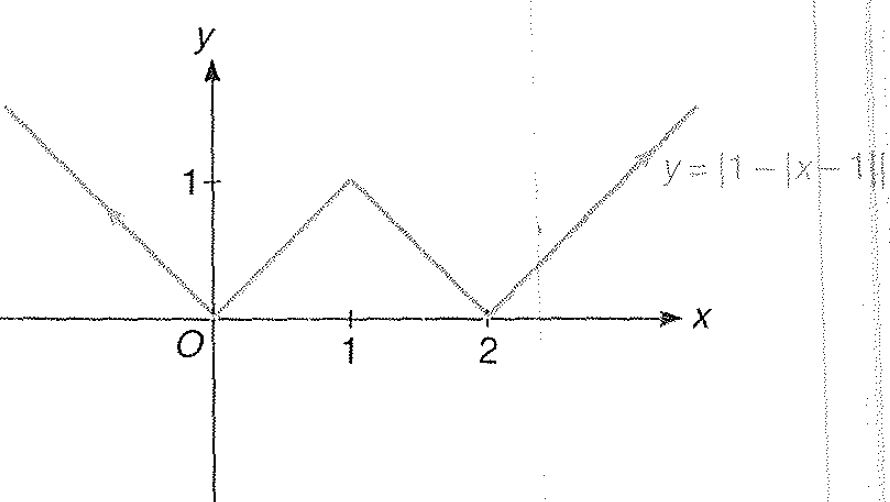
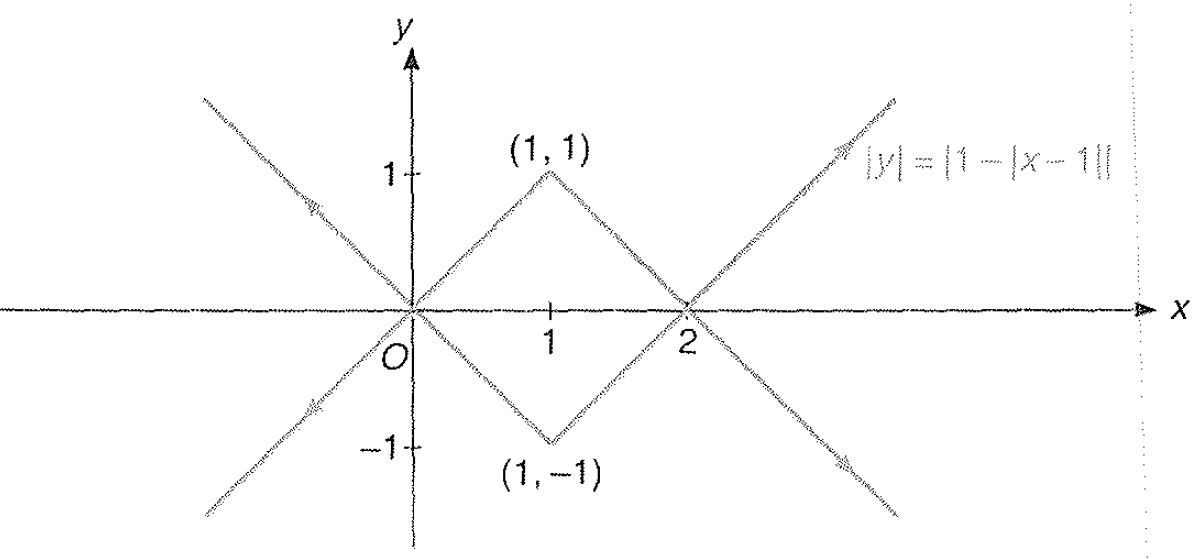
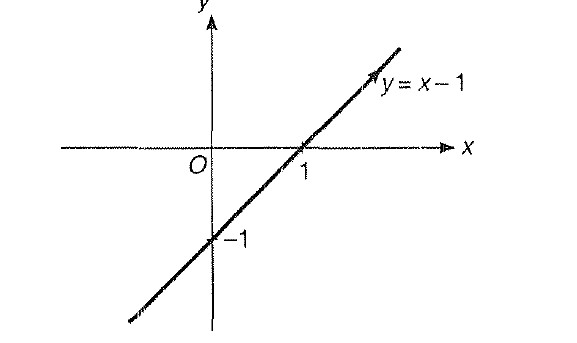
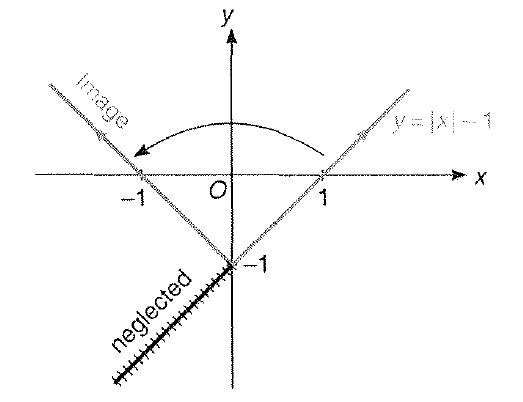
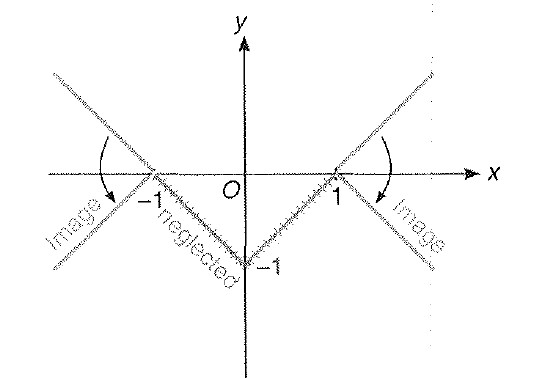
Miscellaneous Example : 4 Draw the graph of `|y| = | 1 - | x-1||`
Step 1 : As we know the graph for y = x - 1
Step 1 : As we know the graph for y = x - 1
Miscellaneous Example -5 : Draw the graph of ` |x|-|y|= 1`
Step 1 : As the graph for `y = x - 1` is known;
Step 1 : As the graph for `y = x - 1` is known;
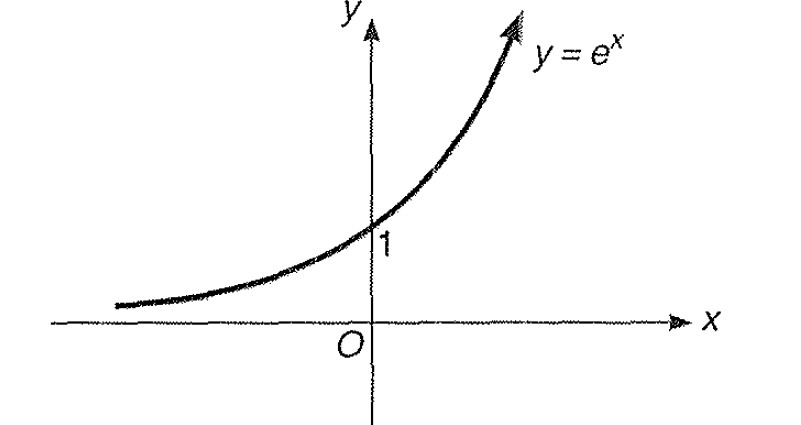
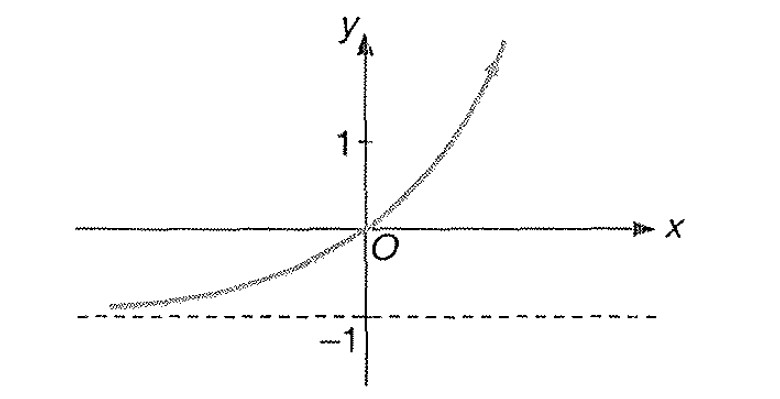
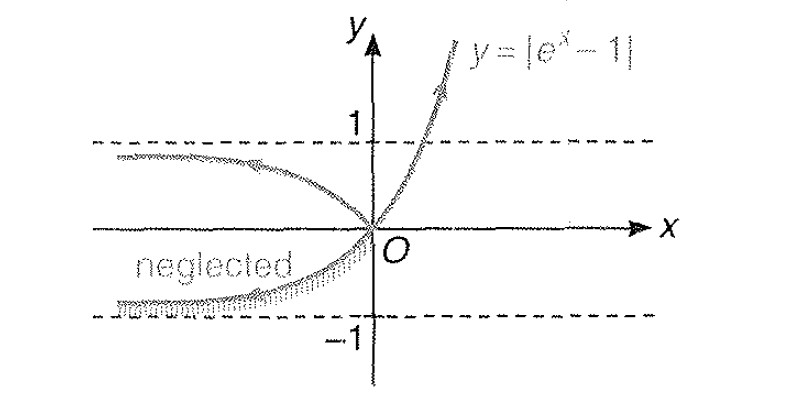
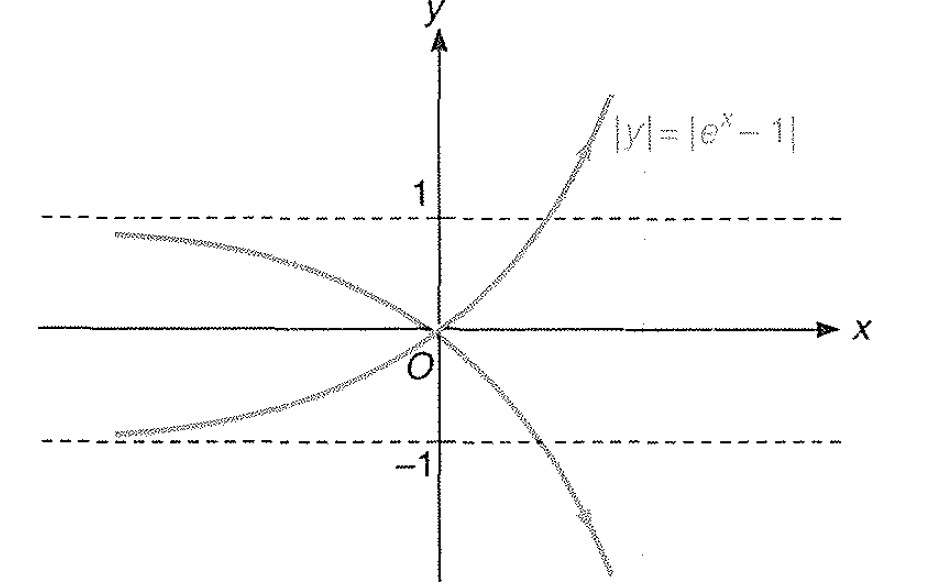
Miscellaneous Example -6 : Draw the graph of `|y|= |e^(x)-1|`
Step 1 : As we know the curve for `y = e^x` is shown as;
Step 1 : As we know the curve for `y = e^x` is shown as;
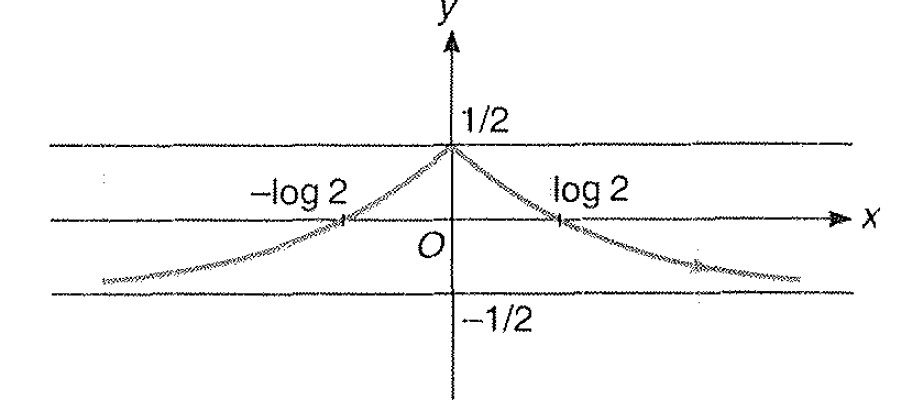
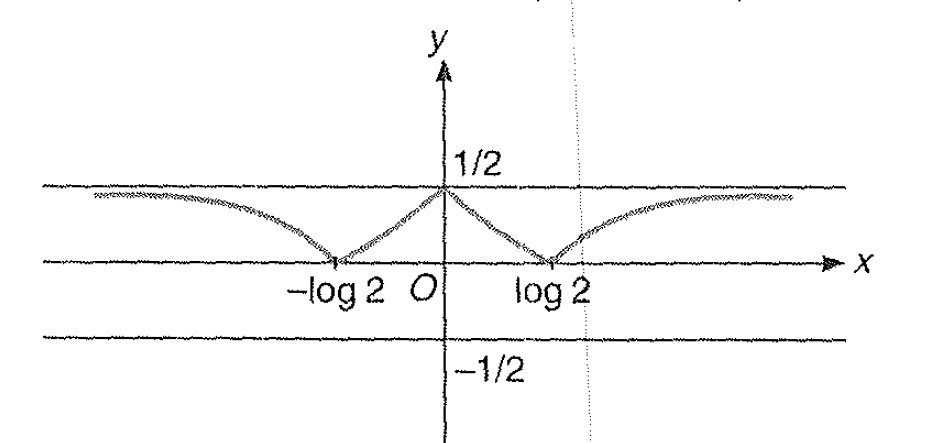
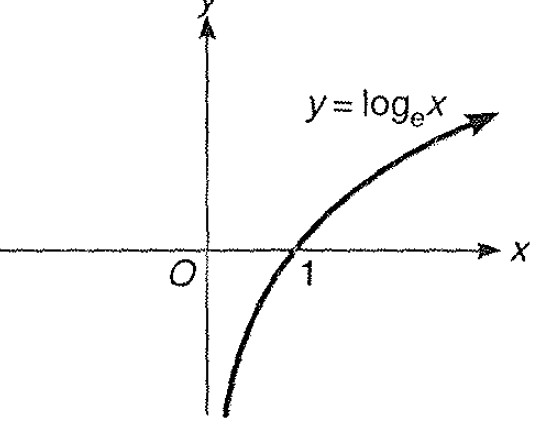
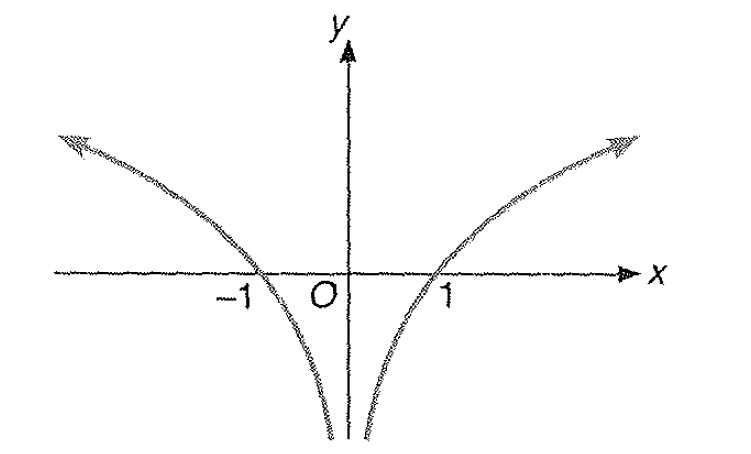
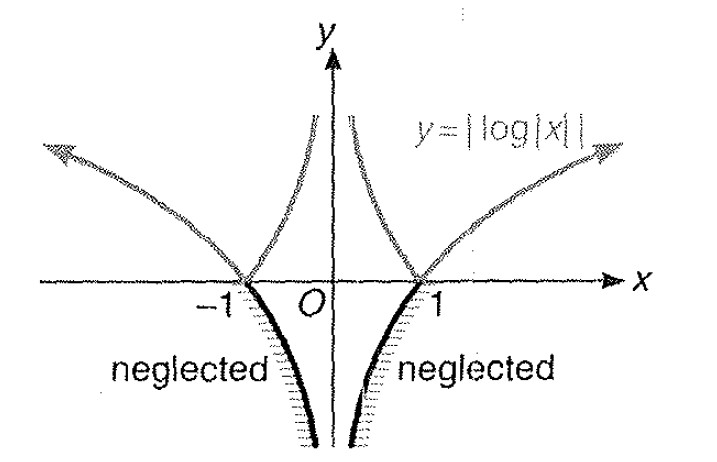
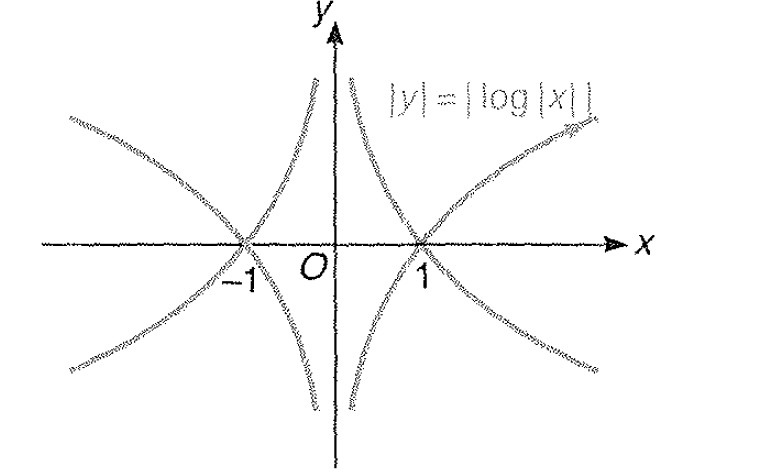
Miscellaneous Example - 7 : Draw the graph of `|y| = | log | x| |`
Step 1 : Here `y= log x` is plotted as;
Step 1 : Here `y= log x` is plotted as;
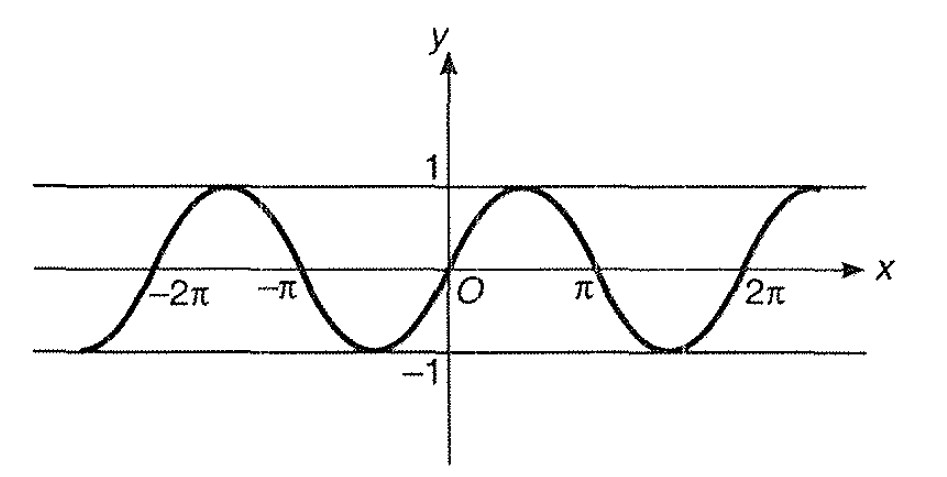
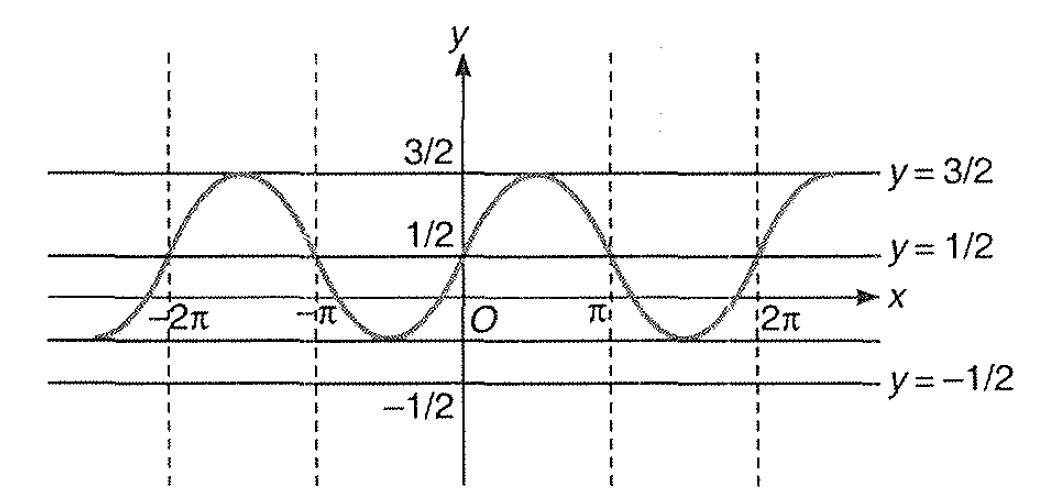
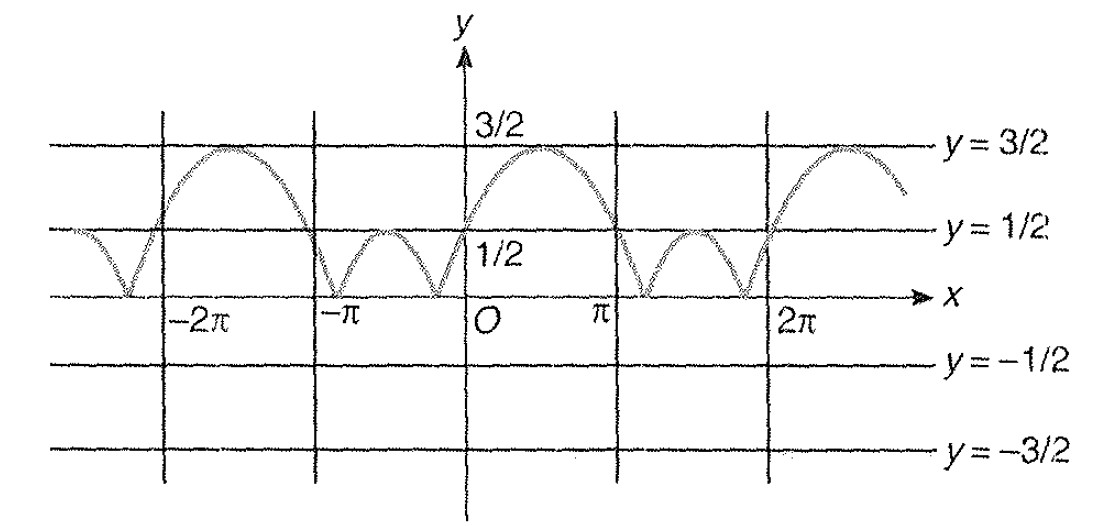
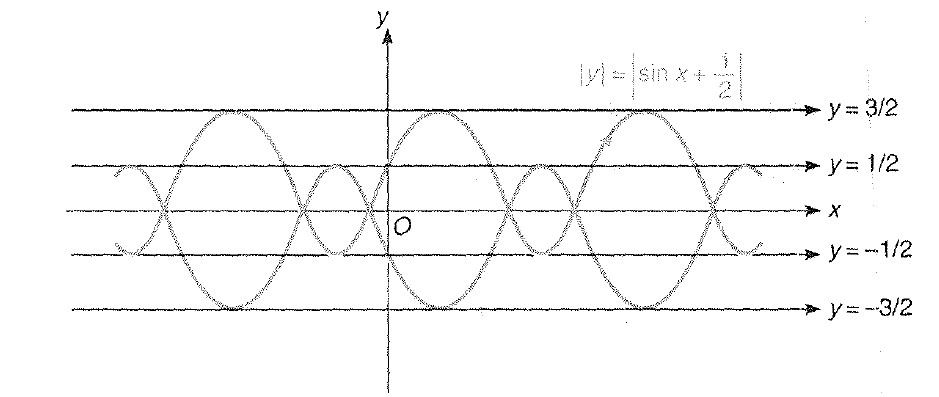
Miscellaneous Example - 8 : Draw the graph of `| y | = | sin x +1/2 |`
Step 1 : Here ; We know that the graph for `y = sin x` is shown as
Step 1 : Here ; We know that the graph for `y = sin x` is shown as
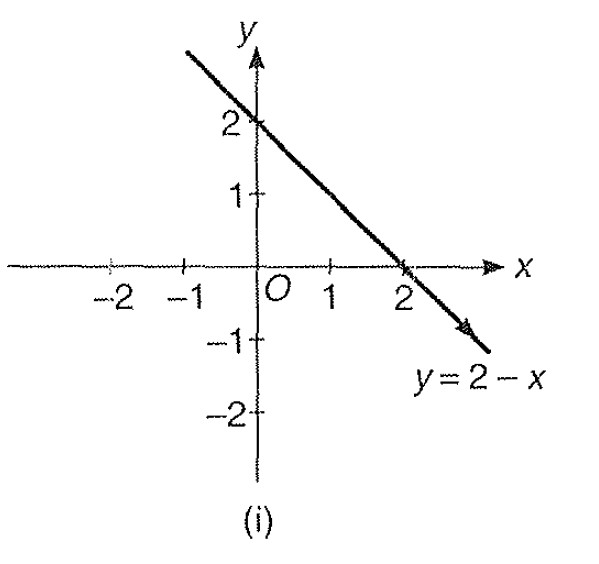
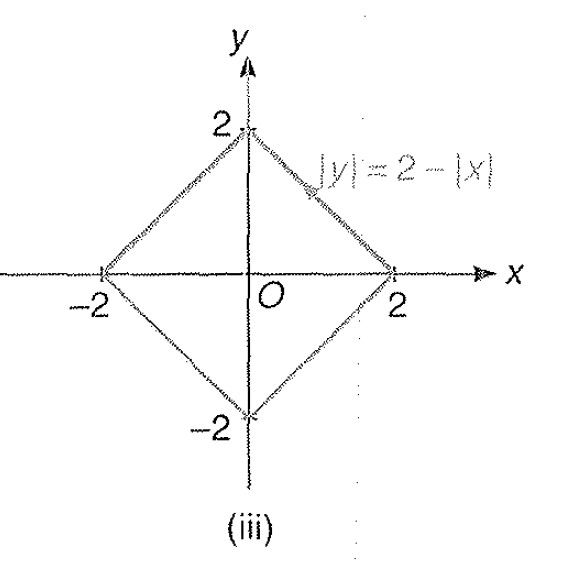
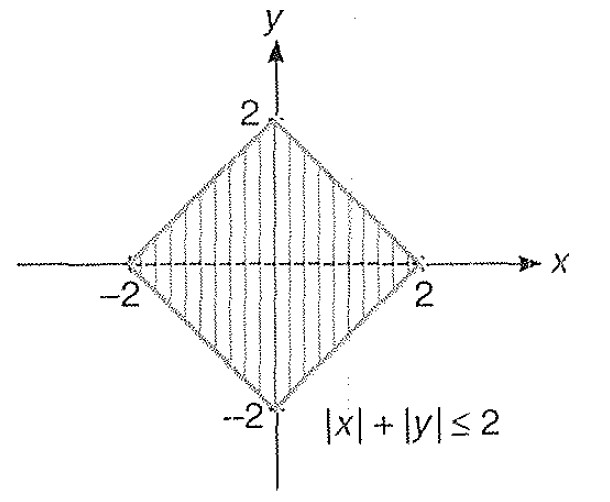
Miscellaneous Example - 9 : Draw the graph of ` | x | + | y | le 2`
Step 1 : Here; `y= 2- x` is plotted as
Step 1 : Here; `y= 2- x` is plotted as
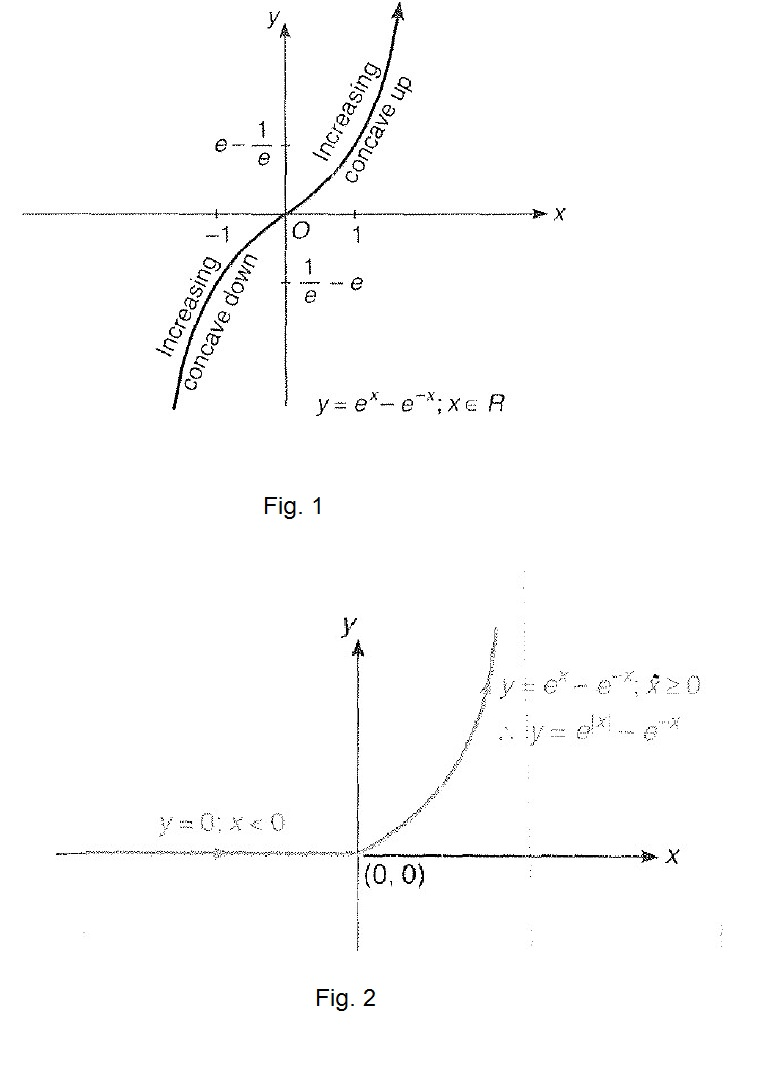
Miscellaneous Example - 10 : Draw the graph of `| y | le | 1 +e^(|x|) - e^(-x) |`
Step 1 : Here `y= e^(|x|)-e^(-x)`
`=> y= { tt (( e^x -e^(-x); , x ge 0), (e^(-x)-e^(-x); , x < 0))`
`y= { tt (( e^x-e^(-x); , x ge 0),(0; , x < 0))`
To discuss;
(i) when `x=0=> y=0` (it passes through origin)
(ii) when `y=0 => e^(2x) -1 =0 => x=0`
(iii) `f(-x) =-f(x)`
as `y=f(x)=e^x-e^(-x)`
`=> f(-x) =e^(-x) -e^x=-f(x);`
it shows `y = f(x) = e^x -e^(-x)` is odd function, i.e., symmetric about origin.
(iv) `y=e^x-e^(-x)`
`=> (dy)/(dx) =e^x+e^(-x) = (e^(2x)+1)/(e^x) > 0` forall `x in R`
`:. y` is increasing for all `x`.
(v) `(d^2y)/(dx^2) =e^x-e^(-x)=(e^(2x)-1)/(e^x)`
`=> (d^2 y)/(dx^2) > 0` when `x >0` concave up and increasing.
also, `(d^2y)/(dx^2) < 0` when `x < 0` concave down and increasing from above discussion `y=e^x-e^(-x)` is plotted as in fig. 1
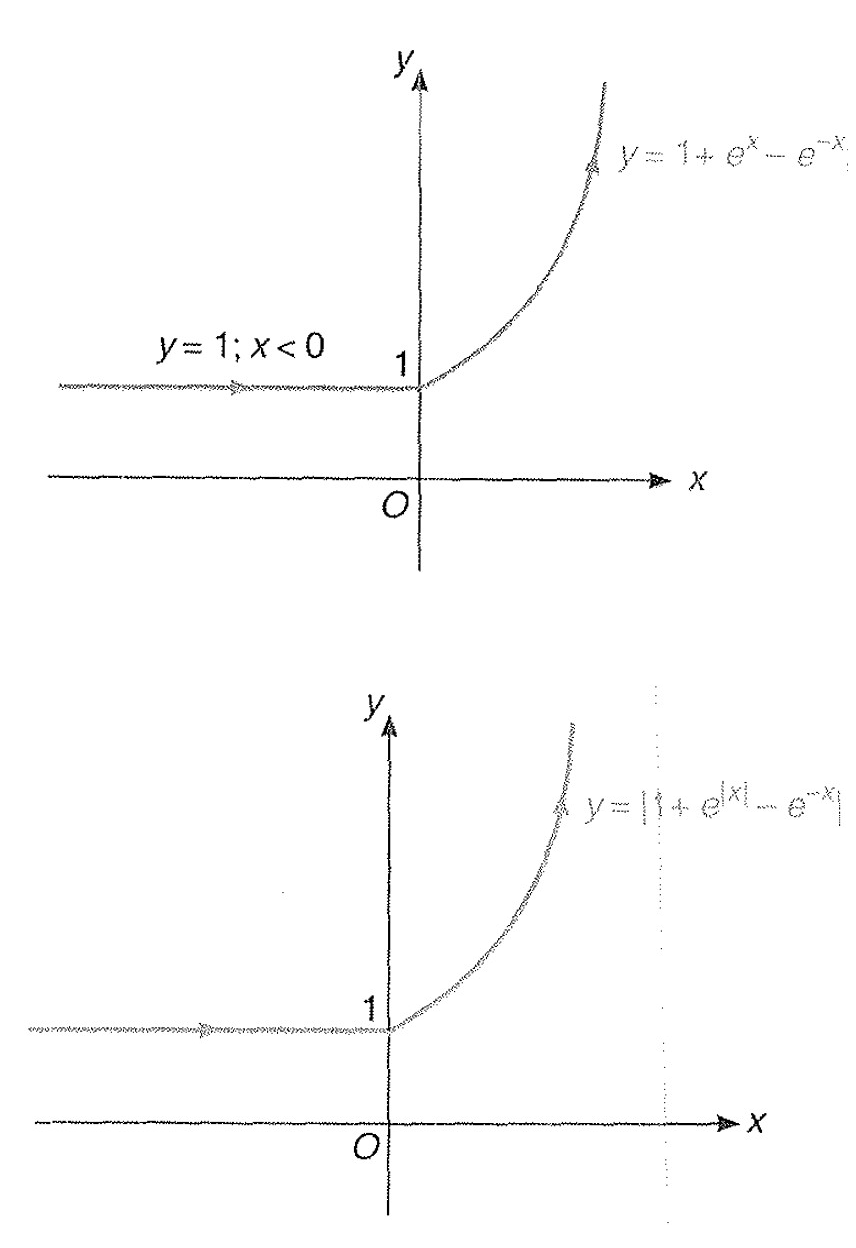
Now, `y= e^(|x|) -e^(-x) = { tt (( e^x-e^(-x); , x ge 0),(0; , x < 0))`
Thus from fig. 2
Step 1 : Here `y= e^(|x|)-e^(-x)`
`=> y= { tt (( e^x -e^(-x); , x ge 0), (e^(-x)-e^(-x); , x < 0))`
`y= { tt (( e^x-e^(-x); , x ge 0),(0; , x < 0))`
To discuss;
(i) when `x=0=> y=0` (it passes through origin)
(ii) when `y=0 => e^(2x) -1 =0 => x=0`
(iii) `f(-x) =-f(x)`
as `y=f(x)=e^x-e^(-x)`
`=> f(-x) =e^(-x) -e^x=-f(x);`
it shows `y = f(x) = e^x -e^(-x)` is odd function, i.e., symmetric about origin.
(iv) `y=e^x-e^(-x)`
`=> (dy)/(dx) =e^x+e^(-x) = (e^(2x)+1)/(e^x) > 0` forall `x in R`
`:. y` is increasing for all `x`.
(v) `(d^2y)/(dx^2) =e^x-e^(-x)=(e^(2x)-1)/(e^x)`
`=> (d^2 y)/(dx^2) > 0` when `x >0` concave up and increasing.
also, `(d^2y)/(dx^2) < 0` when `x < 0` concave down and increasing from above discussion `y=e^x-e^(-x)` is plotted as in fig. 1
Now, `y= e^(|x|) -e^(-x) = { tt (( e^x-e^(-x); , x ge 0),(0; , x < 0))`
Thus from fig. 2
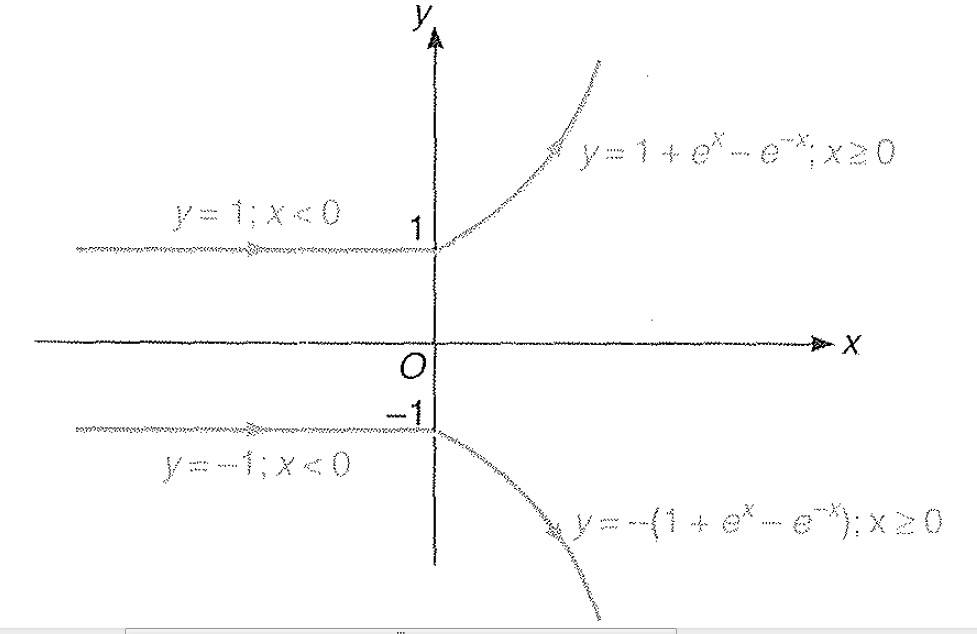
Plotting of `y= | 1 + e^(|x|) - e^(-x) |`
`y= e^(|x|)-e^(-x) ->y = 1 + e^(|x|)-e^(-x)`
`=> y= { tt ((1 + e^x -e^(-x); , x ge 0), (1 ; , x < 0))`
Thus, the graph for `y= | 1 + e^(|x|) - e^(-x) |`
It is same as `y= 1 + e^(|x|) - e^(-x) ` {as y `ge` 1 for all `x in R`}
`y= e^(|x|)-e^(-x) ->y = 1 + e^(|x|)-e^(-x)`
`=> y= { tt ((1 + e^x -e^(-x); , x ge 0), (1 ; , x < 0))`
Thus, the graph for `y= | 1 + e^(|x|) - e^(-x) |`
It is same as `y= 1 + e^(|x|) - e^(-x) ` {as y `ge` 1 for all `x in R`}
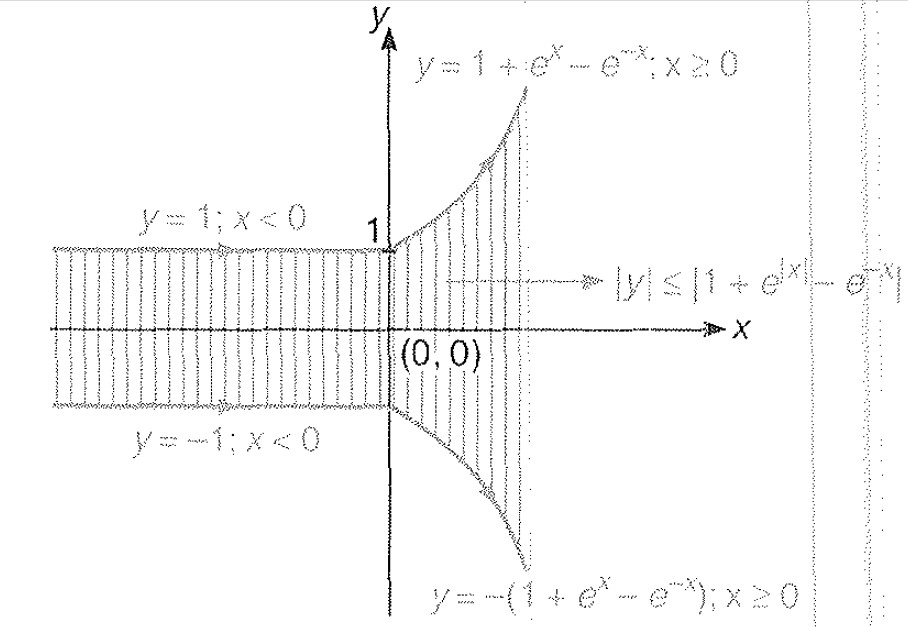
Plotting of `y le | 1 + e^(|x|) - e^(-x) |`
From above figure check any point say `(0,0)`
`0 le 1` (True, thus to shade area towards (0, 0).
From given figure shade part represents the area bounded between two curves.
From above figure check any point say `(0,0)`
`0 le 1` (True, thus to shade area towards (0, 0).
From given figure shade part represents the area bounded between two curves.