Mathematics Revision Notes Of Statistics For NDA
Click for Only Video

Relationship between Mean, Median and Mode

We Know that for symmetric distribution

mean = mode = median

In moderately skewed or asymmetrical distribution a very important relationship exists among these three measures of central tendency.

Mean - Mode = 3 (Mean - Median)

`=>` Mode = 3 Median - 2 Mean

VARIANCE AND STANDARD DEVIATION

The variance of a variable is the arithmetic mean of the squares of all deviations of `x` from the arithmetic mean
of the observations and is denoted by var(`x`) or `sigma^ 2`.

The positive square root of the variance of a variable `x` is known as the standard deviation and is denoted by `sigma`·

Thus, standard deviation `= sqrt(var (x))`.

The calculation of variance and standard deviation can be done by using the following formulas.

(i) For individual series,

`SD = sigma= sqrt([ 1/n sum_(i=1)^n (x_i - bar x)^2])` or `sigma= sqrt([(sum_(i=1)^n x_i^2)/n - bar x^2]`

(ii) For frequency distribution,

`sigma= sqrt([1/N sum_(i=1)^n f_i (x_i - bar x)^2])`

Variance `= sigma^ 2`

For grouped data, it becomes

SD `= sigma= sqrt([(sum_(i=1)^n f_i d_i^2)/N- ((sum_(i=1)^n f_i d_i)/N)^2]), N= sum_(i=1)^n f_i`

where, `N = sum f_i`

where, `d_i = (x_i - bar x)`
`:.` Coefficient of dispersion `= sigma/(bar x)`

and coefficient of variation `= sigma/(bar x) xx 100`

Properties of Standard Deviation

(i) SD is independent of change of origin.

(ii) If the values of the variate `x` are multiplied by a constant, then the SD of the new observation can be
obtained by multiplying the initial SD by the same constant, i.e. if `y = kx`, then `sigma_y = k sigma_x `. Thus, SD is
not dependent of change in scale.

Thus, if `y =ax+ b, sigma_y= | a | sigma_x`

Combined Standard Deviation for Two Series

Let `bar x_1 , bar x_2` be the respective means and `sigma_1, sigma_2` be the respective SD of the two given series. Let `bar x_(12)` be the combined mean. Also, let `D_1 = (bar x_1 - bar x_(12) )` and `D_2 =(bar x_2 - bar x_(12))` Then,

Combined `SD = sigma_(12) = sqrt([(n_1 (sigma_1^2 +D_1^2 )+ n_2 (sigma_2^2 + D_2^2))/(n_1+n_2)])`

Variance `(sigma^2)= 1/(n_1+n_2) [ n_1 (sigma_1^2 + D_1^2)+ n_2(sigma_2^2 + D_2^2)]`

CORRELATION

The tendency of simultaneous variation between two variables is called correlation or covariation. It denotes the degree of inter-
dependence between variables.


`"Correlation Coefficient :"`

The number showing the degree or extent to which `x` are related to each other is called correlation coefficient.
It is denoted by `P(x, y)` or `r_(xy)` or simply `r`.

Methods of Calculating Correlation Coefificients

1. Karl Pearson's Coefficient of Correlation :

Covariance `(x, y) cov (x, y)`

`=1/n sum_(i=1)^n (x_i - bar x) (y_i - bar y) = 1/n sum_(i=1)^n x_i y_i - bar x bar y`

Let `sigma_x` and `sigma_r` the the SD of variables `x` and `y`, respectively. Then coefficient of correlation

`r(x,y) =(cov (x,y))/(sigma_x sigma_y) = (sum_(i=1)^n (x_i - bar x)(y_i - bar y))/(sqrt(sum_(i=1)^n (x_i - bar x)^2 sum_(i=1)^n (y_i - bar y)^2))`

`= (n sum x_i y_i -(sum x_i)(sum y_i))/(sqrt((n sum x_i^2 -(sum x_i)^2)(n sum y_i^2 -(sum y_i)^2))`

2. Rank Correlation (Spearman's) Let `d` be the difference between paired ranks and `n` be the number of items ranked. Then, `rho` the coefficient of rank correlation is given by `rho = 1- (6 sum_(i=1)^n d^2)/(n(n^2-1))`

Note The rank correlation coefficient lies between `- 1` and `1`.

Properties of Correlation

(i) `-1 le r (x,y) le 1`

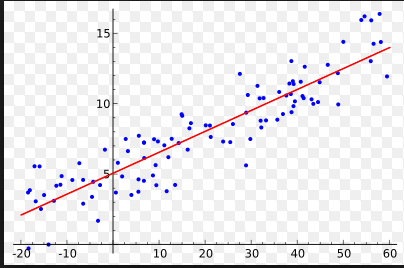
(ii) If `r = 1`, then the coefficient of correlation is perfectly positive.

(iii) If `r =- 1`, the correlation is perfectly negative.

(iv) The correlation coefficient is a pure number independent of the unit of measurement.

(v) The coefficient of correlation is independent of the change in origin and scale.

(vi) If `-1 < r < 1`, it indicates the degree of linear relationship between `x` and `y`, where as its sign tells about the direction of relationship.

(vii) If `x` and `y` are two independent variables, `r = 0`.

(viii) If `r = 0, x` and `y` are said to be uncorrelated. It does not imply that the two variates are independent. `r (x, y)=0`

(ix) If `x` and `y` are random variables and `a, b, c` and `d` are any numbers such that `a =ne 0, c ne 0`, then

`r(ax+b, cy +d)=(|ac|)/(ac) r (x,y)`

LINES OF REGRESSION

The line of regression is the line which gives the best ,estimate to the value of one variable for any specific value of the other variable. Therefore, the line of regression is the line of best fit and is obtained by the principle of least squares.

Regression Analysis

(i) The line of regression of `y` on `x` or regression line of `y` on `x` is given by

`y- bar y = r (sigma_y)/(sigma_x) (X- bar x)`

(ii) The line of regression of `x` on `y` or regression line of `x` on `y` is given by `x-bar x= r (sigma_x)/(sigma_y) (y- bar y)`

(iii) Regression coefficient of `y` on `x`, is denoted by `yx`,

`b_(yx)= r (sigma_y)/(sigma_x) =(cov (x,y))/(sigma_x^2)`

(iv) Regression coefficient of `x` on `y`, is denoted by `xy`,

`b_(xy) = r (sigma_x)/(sigma_y) =(cov (x,y))/(sigma_y^2)`

(v) If `theta` is the angle between the two regression lines, then

`tan theta =((1-r^2))/(|r|) * (sigma_x sigma_y)/(sigma_x^2 + sigma_y^2)`

where , `tan theta=(M_2-M_1)/(1+ M_1 M_2)`

(a) If `r = 0, theta = pi/2`, then the two regression lines are perpendicular to each other.

(b) If `r =1` or `- 1, theta = 0, pi` then the regression lines coincide.

Properties of the· Regression Coefficients

(i) Both regression coefficients and correlation coefficient r have the same sign.

(ii) Coefficient of correlation is the geometric mean between the regression coefficients.

(iii) If one of the regression coefficient is greater than unity, the other must be less than unity

`0 < | b_(xy) b_(yx) | le 1` , if `r ne 0`

i.e. if `| b_(xy) | > 1 , | b_(yx) | < 1`

(iv) Regression coefficients are independent of the change of origin but not of scale.

(v) Arithmetic mean of the regression coefficient is greater than the correlation coefficient.

(vi) The two lines of regression cut each other at the point `(x, y)`. Thus, on solving the two lines of regression, we get the values of means of the variables in the bivariate distribution.

 
SiteLock