Introduction
`\color{red} ✍️` We know that statistics deals with data collected for specific purposes. We can make decisions about the data by analysing and interpreting it.
`\color{red} ✍️` In earlier classes, we have studied methods of representing data graphically and in tabular form.
`\color{red} ✍️` This representation reveals certain salient features or characteristics of the data. We have also studied the methods of finding a representative value for the given data. `color(vlue)("This value is called the measure of central tendency. ")`
Recall mean (arithmetic mean), median and mode are three measures of central tendency.
`\color{red} ✍️` A measure of central tendency gives us a rough idea where data points are centred. But, in order to make better interpretation from the data, we should also have an idea how the data are scattered or how much they are bunched around a measure of central tendency.
`color(red)(=>"Consider now the runs scored by two batsmen")` in their last ten matches as follows:
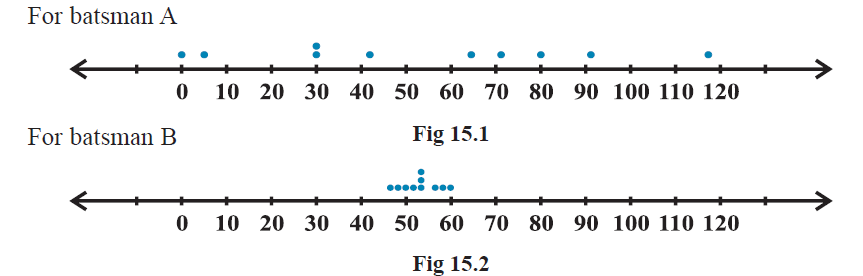
`color{orange}("Batsman A" : 30, 91, 0, 64, 42, 80, 30, 5, 117, 71)`
`color{orange}("Batsman B" : 53, 46, 48, 50, 53, 53, 58, 60, 57, 52)`
Clearly, the mean and median of the data are
`color{navy}(\ \ \ \ \ \ \ \ \ \ \ "Batsman A" \ \ \ \ \ \ \ \ \ \ \ "Batsman B")`
`color{orange}("Mean" \ \ \ \ \ \ \ \ \ \ 53\ \ \ \ \ \ \ \ \ \ \ \ \ \ \ \ \ 53)`
`color{orange}("Median" \ \ \ \ \ \ \ \ \53\ \ \ \ \ \ \ \ \ \ \ \ \ \ \ \ \ 53)`
Recall that, we calculate the mean of a data (denoted by `color(blue)(barx)` ) by dividing the sum of the observations by the number of observations, i.e
`color{blue}(barx = 1/n sum_(i=1)^(n) x_i)`
Also, the median is obtained by first arranging the data in ascending or descending order and applying the following rule.
`\color{red} ✍️` If the number of observations is odd, then the median is `color{orange}(((n+1)/2)^(th))` observation.
`\color{red} ✍️` If the number of observations is even, then median is the mean of `color{orange}((n/2)^(th))` and `color{orange}(((n+1)/2)^(th))` observations.
`\color{red} ✍️` We find that the mean and median of the runs scored by both the batsmen `A` and `B` are same i.e., `53.` Can we say that the performance of two players is same?
Clearly No, because the variability in the scores of batsman `A` is from `0` (minimum) to `117` (maximum).
Whereas, the range of the runs scored by batsman `B` is from `46` to `60`.
Let us now plot the above scores as dots on a number line. We find the following diagrams:
`\color{red} ✍️` We can see that the dots corresponding to batsman `B` are close to each other and are clustering around the measure of central tendency (mean and median), while those corresponding to batsman `A` are scattered or more spread out.
`\color{red} ✍️` Thus, the measures of central tendency are not sufficient to give complete information about a given data.
`\color{red} ✍️` Variability is another factor which is required to be studied under statistics. Like ‘measures of central tendency’ we want to have a single number to describe variability. This single number is called a ‘measure of dispersion’.
`\color{red} ✍️` In this Chapter, we shall learn some of the important measures of dispersion and their methods of calculation for ungrouped and grouped data.
`\color{red} ✍️` In earlier classes, we have studied methods of representing data graphically and in tabular form.
`\color{red} ✍️` This representation reveals certain salient features or characteristics of the data. We have also studied the methods of finding a representative value for the given data. `color(vlue)("This value is called the measure of central tendency. ")`
Recall mean (arithmetic mean), median and mode are three measures of central tendency.
`\color{red} ✍️` A measure of central tendency gives us a rough idea where data points are centred. But, in order to make better interpretation from the data, we should also have an idea how the data are scattered or how much they are bunched around a measure of central tendency.
`color(red)(=>"Consider now the runs scored by two batsmen")` in their last ten matches as follows:
`color{orange}("Batsman A" : 30, 91, 0, 64, 42, 80, 30, 5, 117, 71)`
`color{orange}("Batsman B" : 53, 46, 48, 50, 53, 53, 58, 60, 57, 52)`
Clearly, the mean and median of the data are
`color{navy}(\ \ \ \ \ \ \ \ \ \ \ "Batsman A" \ \ \ \ \ \ \ \ \ \ \ "Batsman B")`
`color{orange}("Mean" \ \ \ \ \ \ \ \ \ \ 53\ \ \ \ \ \ \ \ \ \ \ \ \ \ \ \ \ 53)`
`color{orange}("Median" \ \ \ \ \ \ \ \ \53\ \ \ \ \ \ \ \ \ \ \ \ \ \ \ \ \ 53)`
Recall that, we calculate the mean of a data (denoted by `color(blue)(barx)` ) by dividing the sum of the observations by the number of observations, i.e
`color{blue}(barx = 1/n sum_(i=1)^(n) x_i)`
Also, the median is obtained by first arranging the data in ascending or descending order and applying the following rule.
`\color{red} ✍️` If the number of observations is odd, then the median is `color{orange}(((n+1)/2)^(th))` observation.
`\color{red} ✍️` If the number of observations is even, then median is the mean of `color{orange}((n/2)^(th))` and `color{orange}(((n+1)/2)^(th))` observations.
`\color{red} ✍️` We find that the mean and median of the runs scored by both the batsmen `A` and `B` are same i.e., `53.` Can we say that the performance of two players is same?
Clearly No, because the variability in the scores of batsman `A` is from `0` (minimum) to `117` (maximum).
Whereas, the range of the runs scored by batsman `B` is from `46` to `60`.
Let us now plot the above scores as dots on a number line. We find the following diagrams:
`\color{red} ✍️` We can see that the dots corresponding to batsman `B` are close to each other and are clustering around the measure of central tendency (mean and median), while those corresponding to batsman `A` are scattered or more spread out.
`\color{red} ✍️` Thus, the measures of central tendency are not sufficient to give complete information about a given data.
`\color{red} ✍️` Variability is another factor which is required to be studied under statistics. Like ‘measures of central tendency’ we want to have a single number to describe variability. This single number is called a ‘measure of dispersion’.
`\color{red} ✍️` In this Chapter, we shall learn some of the important measures of dispersion and their methods of calculation for ungrouped and grouped data.