LATITUDINAL GRADIENTS
● The `color{violet}("diversity of plants")` and `color{violet}("animals")` is not uniform throughout the world but shows a rather uneven
distribution.
● For many group of `color{violet}("animals")` or `color{violet}("plants")`, there are interesting patterns in `color{violet}("diversity")`, the most well- known being the `color{brown}("latitudinal gradient")` in `color{violet}("diversity.")`
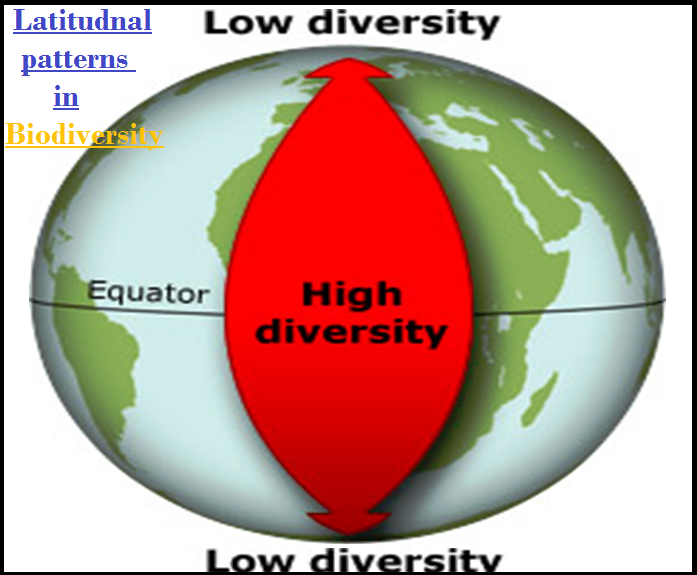
● In general, species `color{violet}("diversity decreases")` as we move away from the equator towards the poles.
● With very few exceptions, tropics (`color{violet}("latitudinal range of 23.5° N to 23.5° S")`) harbour more species than `color{violet}("temperate or polar areas.")`
● Colombia located near the equator has nearly `color{violet}("1,400 species of birds")` while New York at `color{violet}("41° N")` has `color{violet}("105 species")` and Greenland at `color{violet}("71° N")` only `color{violet}("56 species.")`
● India, with much of its land area in the `color{violet}("tropical latitudes")`, has more than `color{violet}("1,200 species of birds.")`
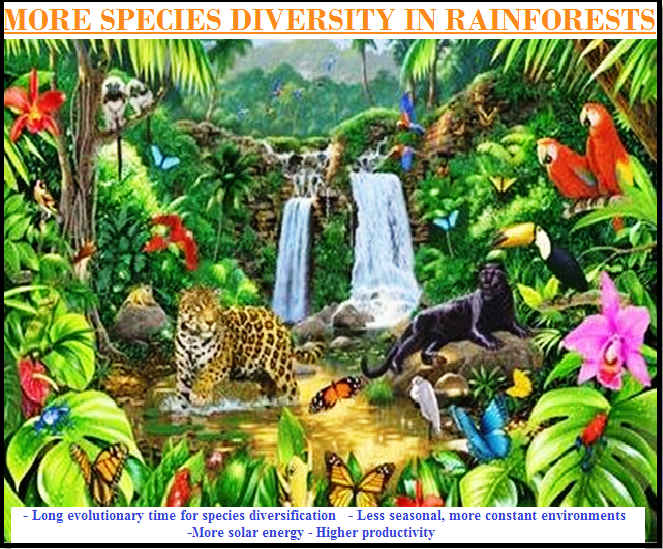
● A forest in a `color{violet}("tropical region")` like `color{violet}("Equador")` has up to 10 times as many species of vascular plants as a forest of equal area in a `color{violet}("temperate region")` like the Midwest of the USA.
● The largely `color{violet}("tropical Amazonian rain")` forest in South America has the `color{violet}("greatest biodiversity")` on earth- it is home to more than `color{violet}("40,000 species of plants, 3,000 of fishes, 1,300 of birds,")` `color{violet}("427 of mammals, 427 of amphibians")`, `color{violet}("378 of reptiles and of more than 1,25,000 invertebrates.")`
distribution.
● For many group of `color{violet}("animals")` or `color{violet}("plants")`, there are interesting patterns in `color{violet}("diversity")`, the most well- known being the `color{brown}("latitudinal gradient")` in `color{violet}("diversity.")`
● In general, species `color{violet}("diversity decreases")` as we move away from the equator towards the poles.
● With very few exceptions, tropics (`color{violet}("latitudinal range of 23.5° N to 23.5° S")`) harbour more species than `color{violet}("temperate or polar areas.")`
● Colombia located near the equator has nearly `color{violet}("1,400 species of birds")` while New York at `color{violet}("41° N")` has `color{violet}("105 species")` and Greenland at `color{violet}("71° N")` only `color{violet}("56 species.")`
● India, with much of its land area in the `color{violet}("tropical latitudes")`, has more than `color{violet}("1,200 species of birds.")`
● A forest in a `color{violet}("tropical region")` like `color{violet}("Equador")` has up to 10 times as many species of vascular plants as a forest of equal area in a `color{violet}("temperate region")` like the Midwest of the USA.
● The largely `color{violet}("tropical Amazonian rain")` forest in South America has the `color{violet}("greatest biodiversity")` on earth- it is home to more than `color{violet}("40,000 species of plants, 3,000 of fishes, 1,300 of birds,")` `color{violet}("427 of mammals, 427 of amphibians")`, `color{violet}("378 of reptiles and of more than 1,25,000 invertebrates.")`